On this page
Seed packets and garden centers talk about zones constantly, so it is natural to assume your zone tells you when to put tomatoes in the ground. It does not. Two towns in the same zone can have last frosts weeks apart.
Getting this one idea straight saves more lost seedlings than any product you can buy.
Key figures
- 10°F Temperature span of a full USDA hardiness zone
- 5°F Temperature span of a USDA hardiness half-zone
- 32°F Freezing point used for local frost dates
What a hardiness zone actually measures
The USDA Plant Hardiness Zone Map is based on the average annual extreme minimum winter temperature: the single coldest night of each year, averaged over three decades. The map splits the country into 10°F zones and 5°F half zones.
That makes it the right tool for one question: will this shrub, tree or perennial survive my winter? It says nothing about when spring warms up. A place with mild winters and a late, cold spring can share a zone with a place that warms early.
The current map, released in 2023, uses 1991 to 2020 data from more than 13,000 weather stations. About half the country moved into the next warmer half zone compared with the 2012 map, which is one more reason not to lean on an old zone number from a seed catalog.
The date that runs your calendar
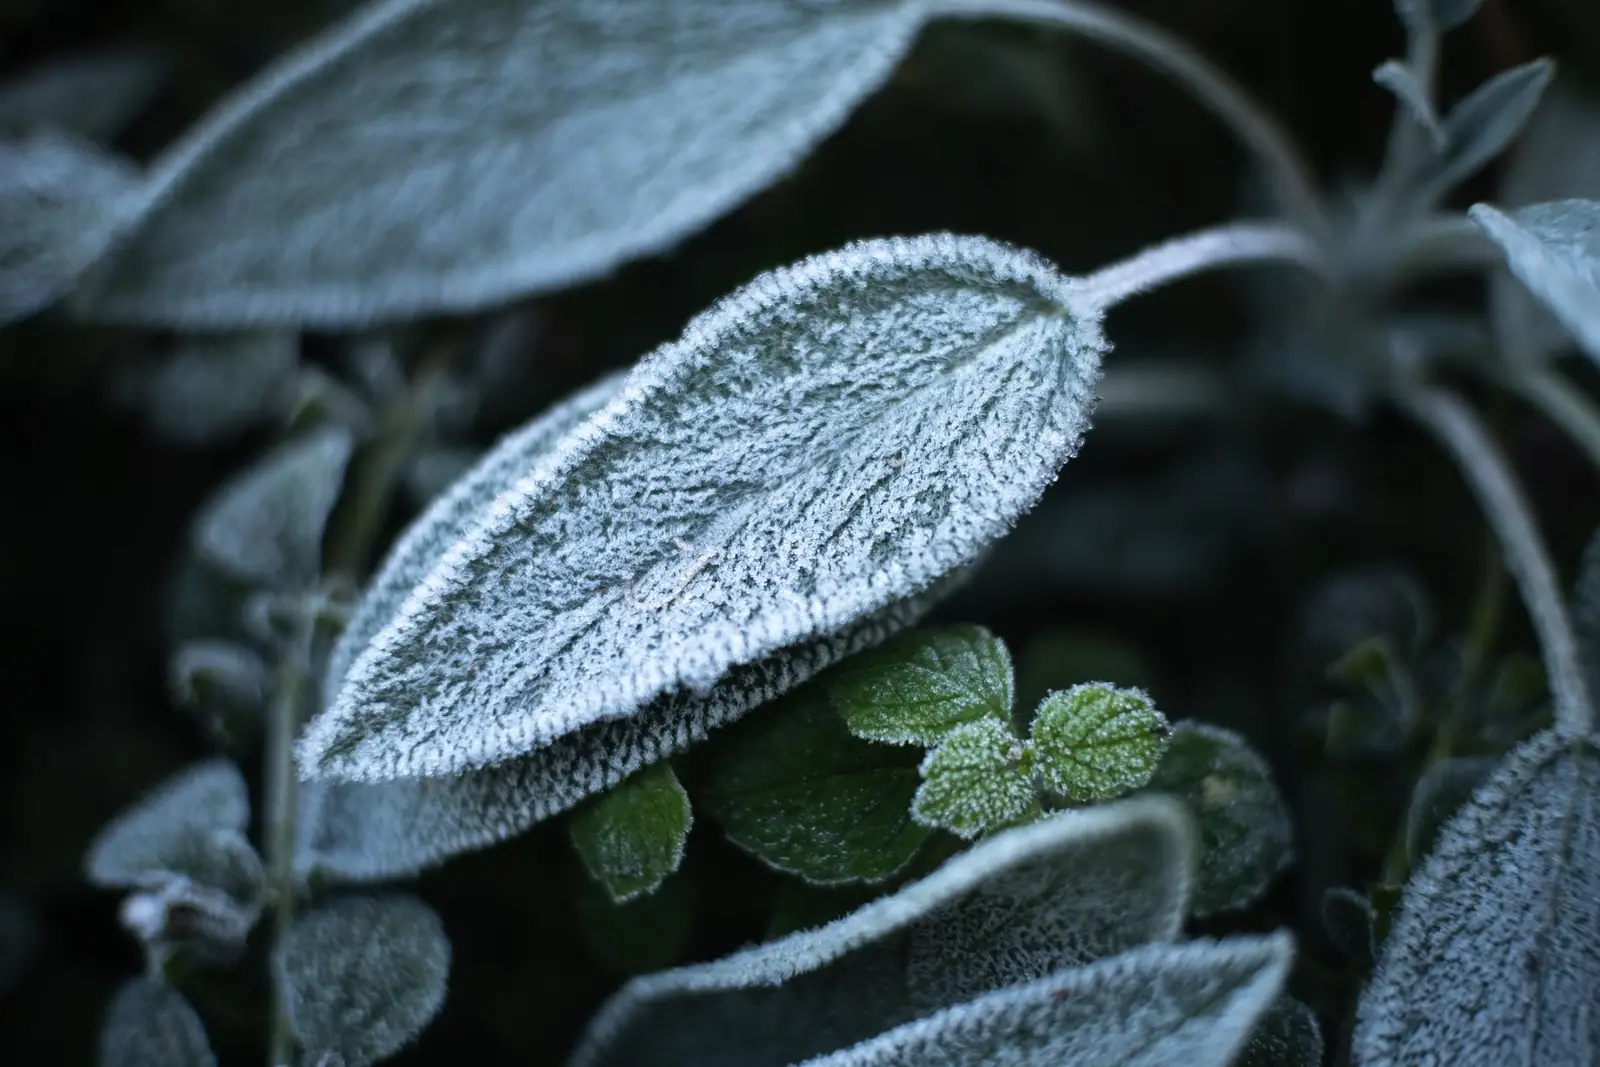
For vegetables, the number that matters is your average last spring freeze: the date after which temperatures typically stop dropping to 32°F. NOAA publishes these from the same 1991 to 2020 climate normals, and its interactive map lets you look up the typical range for your area.
Here is the part most people miss. An average date means that in roughly half of years the last freeze comes later. NOAA’s agricultural normals also give dates at lower probabilities, such as the point where there is only a 10 percent chance of a later freeze. Cautious gardeners plant frost-tender crops closer to that date.
How to build your planting calendar
Once you have the date, everything else is counting:
- Find your average last freeze on NOAA’s map or through your state extension office.
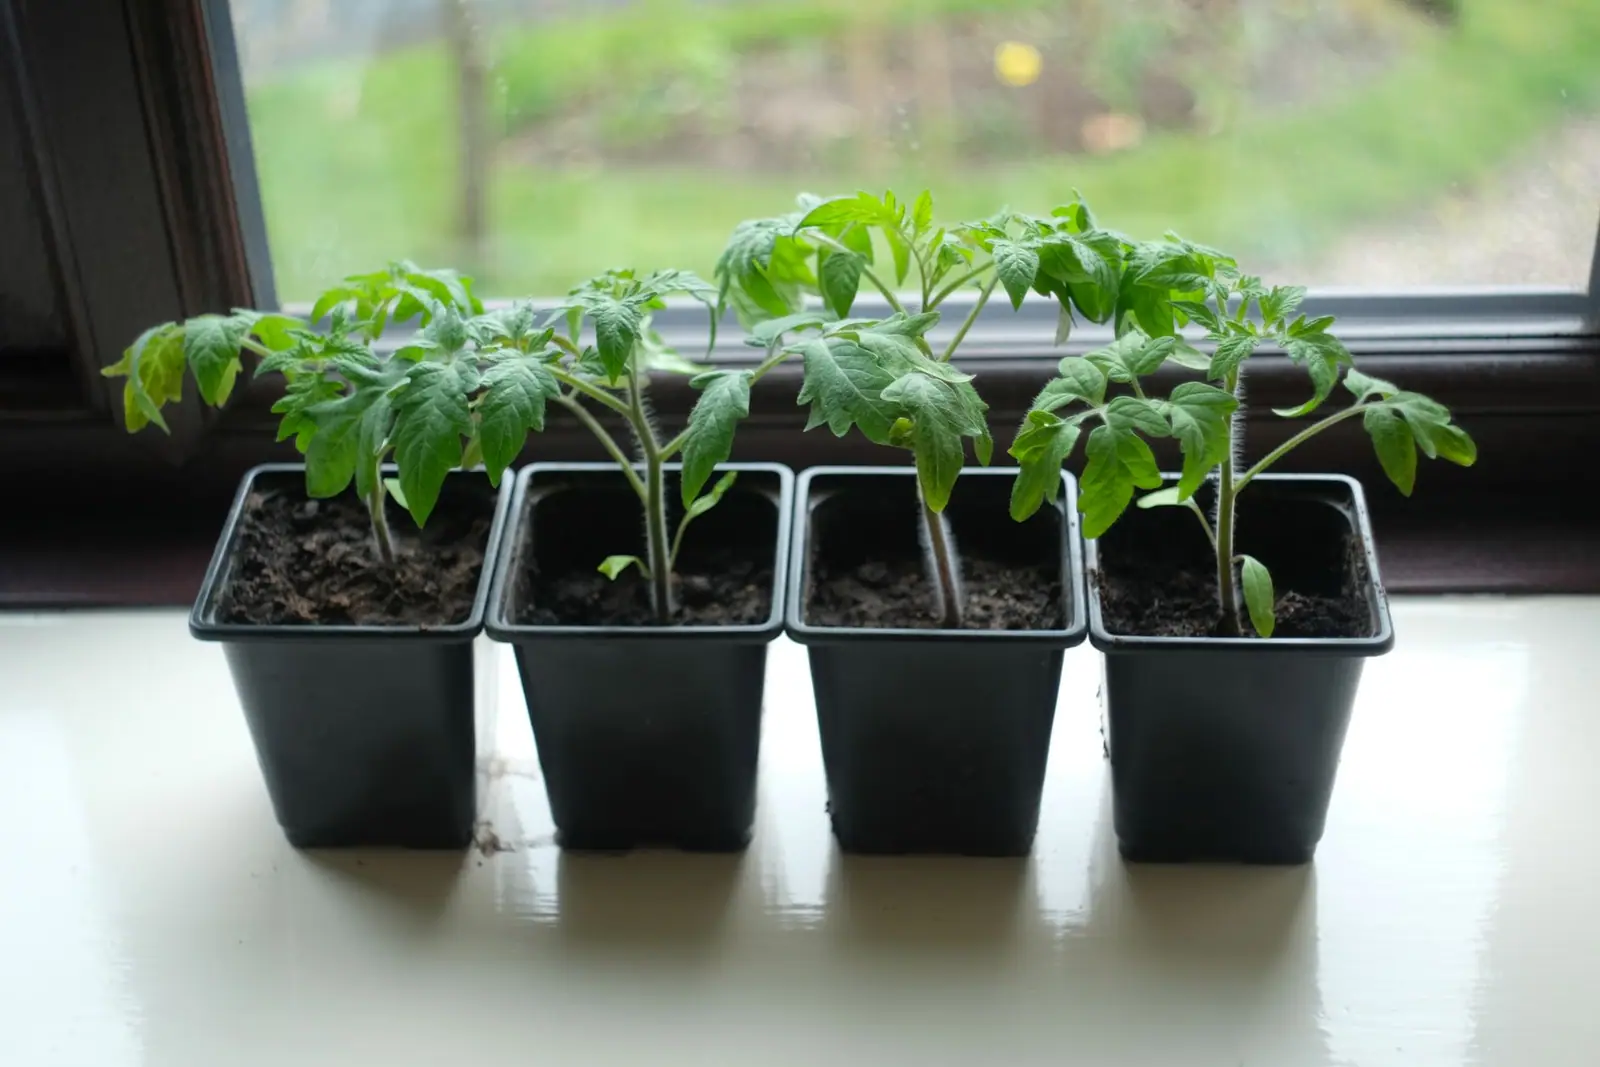
- Start slow crops indoors early. Peppers and tomatoes typically go in six to ten weeks before the last frost.
- Plant hardy crops before the date. Peas, lettuce, spinach and cabbage-family transplants tolerate light frost.
- Wait on tender crops. Tomatoes, peppers, squash, cucumbers and beans go out after the frost risk has passed and nights stay mild.
- Keep a sheet or cover ready for the late cold snap that arrives anyway.
Warm-season seeds like beans and squash rot in cold soil even after the last frost. A cheap soil thermometer pushed in a few inches tells you more than any date.
When to use your zone after all
Your zone still matters for perennial food plants: asparagus, rhubarb, fruit trees, berries and perennial herbs. Check that each one is rated for your zone before buying, then time the planting by your frost date like everything else.
Related reading: Does a Vegetable Garden Actually Save You Money? and How Much to Plant Per Person Without Wasting a Harvest.
Questions people ask
What is the difference between a hardiness zone and a frost date?
A hardiness zone is based on the coldest winter temperature and tells you which perennials survive. A frost date is when freezing temperatures typically end in spring or start in fall, and it tells you when to plant.
Is it safe to plant on the average last frost date?
Not for tender crops. An average date means a later frost is still fairly likely. Wait a week or two, or use a lower-probability date from NOAA's data.
Did my zone change in 2023?
Possibly. About half of the country shifted into the next warmer half zone on the 2023 USDA map. Look up your ZIP code on the official site.
Where do I find my last frost date?
NOAA's National Centers for Environmental Information publishes last spring freeze dates, and your state cooperative extension office usually has a local planting calendar.
Where these figures come from
- 2023 USDA Plant Hardiness Zone Map USDA Agricultural Research Service · planthardiness.ars.usda.gov
- New USDA Plant Hardiness Zone map shows most of Southeast has gotten one half zone warmer University of Georgia Extension · site.extension.uga.edu
- When to Expect Your Last Spring Freeze NOAA National Centers for Environmental Information · ncei.noaa.gov
- Interactive map: average date of last spring freeze NOAA Climate.gov · climate.gov
Figures last checked September 2026.